Reports
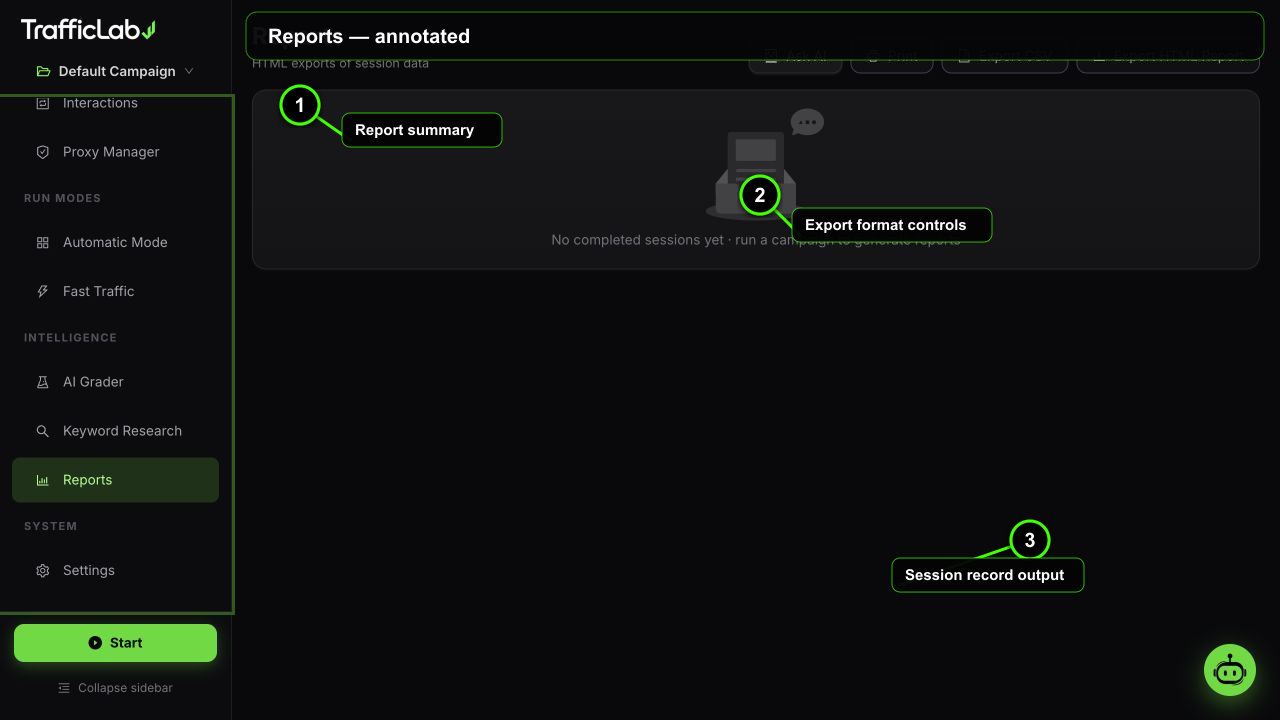
- 1Report summary
- 2Export format controls
- 3Session record output
Reports turns the stored session data into shareable output: a summary view, a full CSV export, a styled HTML report and a print-ready version.
Summary statistics
The summary card also lists the traffic source, device and browser breakdown as tags, so a quick glance tells you how the run was distributed.
Export CSV
The CSV export includes every session with all its details:
Campaign, Generated, Completed, Failed, Success rate,
Avg duration (s), Recurring,
Session ID, URL, Keyword, Device, OS, Browser, Source,
Country, City, Profile, Stage, Success, Recurring,
Started, Duration (s)- One row per session, with the short session ID, target URL, typed keyword, identity fields, source, geo, humanizer profile, stage and outcome.
- UTF-8 with BOM, so Excel opens it correctly.
- File name:
trafficlab-report-campaignname.csv. - Enabled only when at least one session exists.
Export HTML
Generates a standalone HTML report in the app's dark theme with:
- KPI cards: completed, failed, success rate, average duration, recurring visitors.
- Source, device and browser breakdown tables.
- The last 300 log events with colors for errors and successes.
- Print-friendly CSS built in, so the exported file also prints cleanly.
Opens a light-theme version of the same report in a hidden iframe and invokes the system print dialog. Use it to produce PDFs or paper copies directly from the app.
Ask AI
The Ask AI button sends your current report summary to the AI agent, which reads the live store and answers with a plain-language summary and next-step suggestions. See AI Agent Chat for setup.
Related
- Live Dashboard: the live view of the same data.
- Settings: Reset data and Clear sessions controls.