Live Dashboard
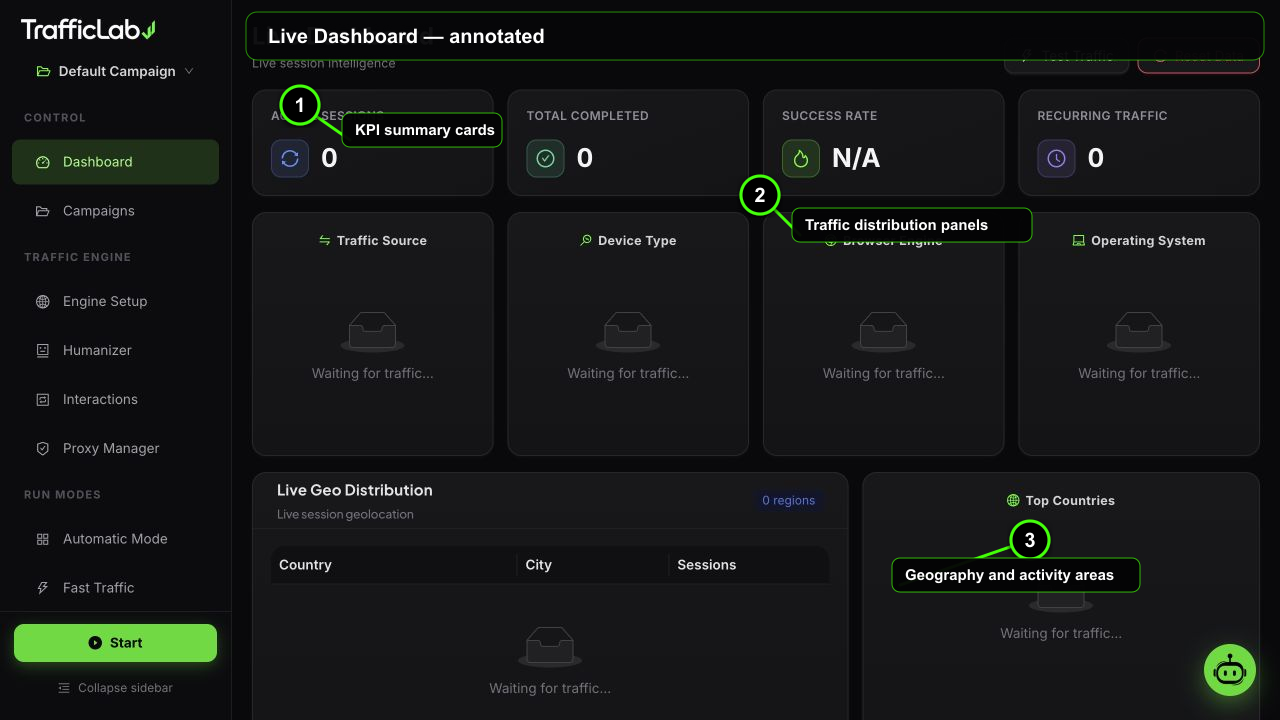
- 1KPI summary cards
- 2Traffic distribution panels
- 3Geography and activity areas
The Live Dashboard streams every engine event in real time. It is the first page you see and the place you will watch while a run is active.
KPI cards
- Active: sessions currently running. The icon spins while the engine runs.
- Completed: sessions that finished successfully.
- Success rate: completed sessions divided by completed plus failed, as a percentage.
- Recurring: sessions marked as returning visitors (repeat visits), tracked per campaign.
Values count up smoothly instead of jumping, so it is easy to see changes while a run is live. The numbers are per-session records, not simulated placeholders.
Distribution donuts
- Source: organic, social, direct or custom, as configured in Engine Setup.
- Device: desktop, mobile, tablet.
- Browser identity: Chrome, Firefox, Safari, Edge; these are identities applied to isolated private Chromium sessions.
- OS: Windows, macOS, iOS, Android, Linux.
Hover any slice for the exact count and percentage. Each donut shows the total number of sessions in its center and a legend with per-slice values underneath.
Geography
The regions table lists the top countries and cities with a progress bar per region (relative to the leader) and exact session counts. Next to it, the countries donut shows the country breakdown at a glance.
| Country | City | Sessions |
|---|---|---|
| United States | New York | |
| Germany | Berlin | |
| India | Mumbai | |
| United Kingdom | London | |
| Brazil | São Paulo |
Session log
The bottom card streams the live event log: time, session ID (short tag), and the event message. Levels are color coded: errors in red, successes in green, everything else in neutral. A tag on the card shows Live while the engine runs and Idle when it stops. The log keeps the last 200 events on screen.
Typical events you will see:
engine startedwith the run mode (manual, automatic, fast).session newwith the target URL, keyword, device, OS, browser, source and profile.session updateon every stage change: warming, searching, browsing, interacting, completed, failed.engine stoppedwith the run summary.
Actions
- Test Traffic: runs a single quick session through the current campaign. A fast way to verify URLs, keywords and the engine without a full run. Disabled while running.
- Reset Data: clears all sessions and stats for a clean slate. Requires confirmation, disabled while running.